Professor Hod Lipson, Sofia Wyetzner
Creative Machines Lab, Columbia University
June - December 2019
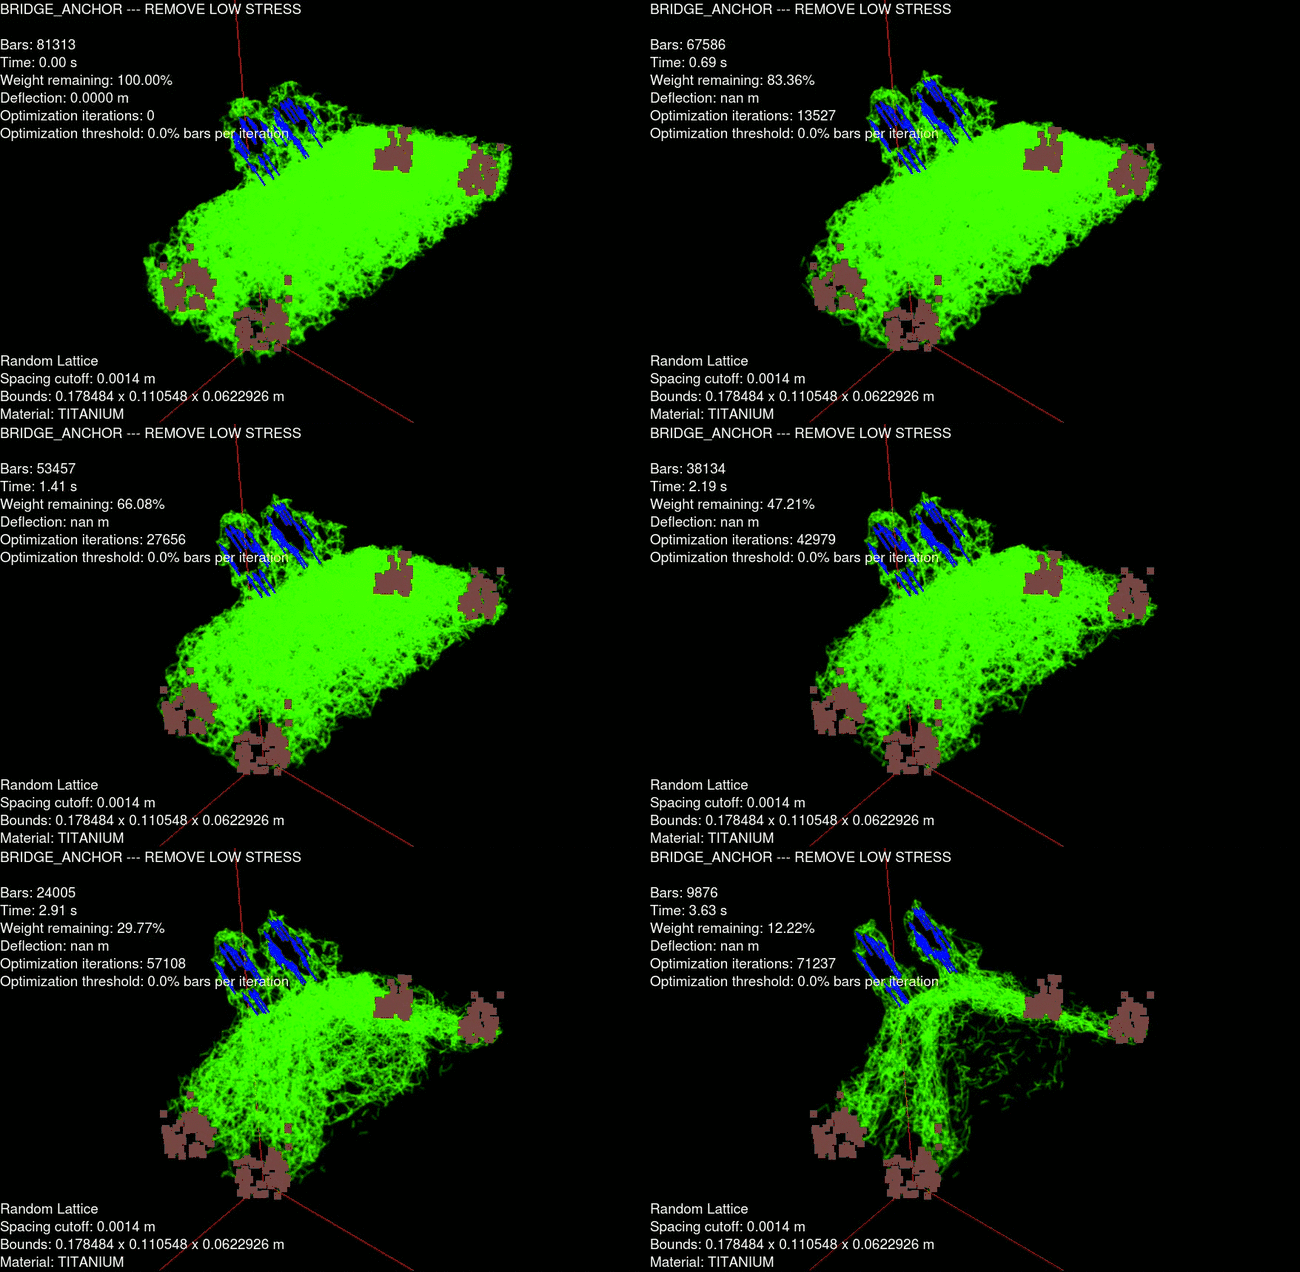
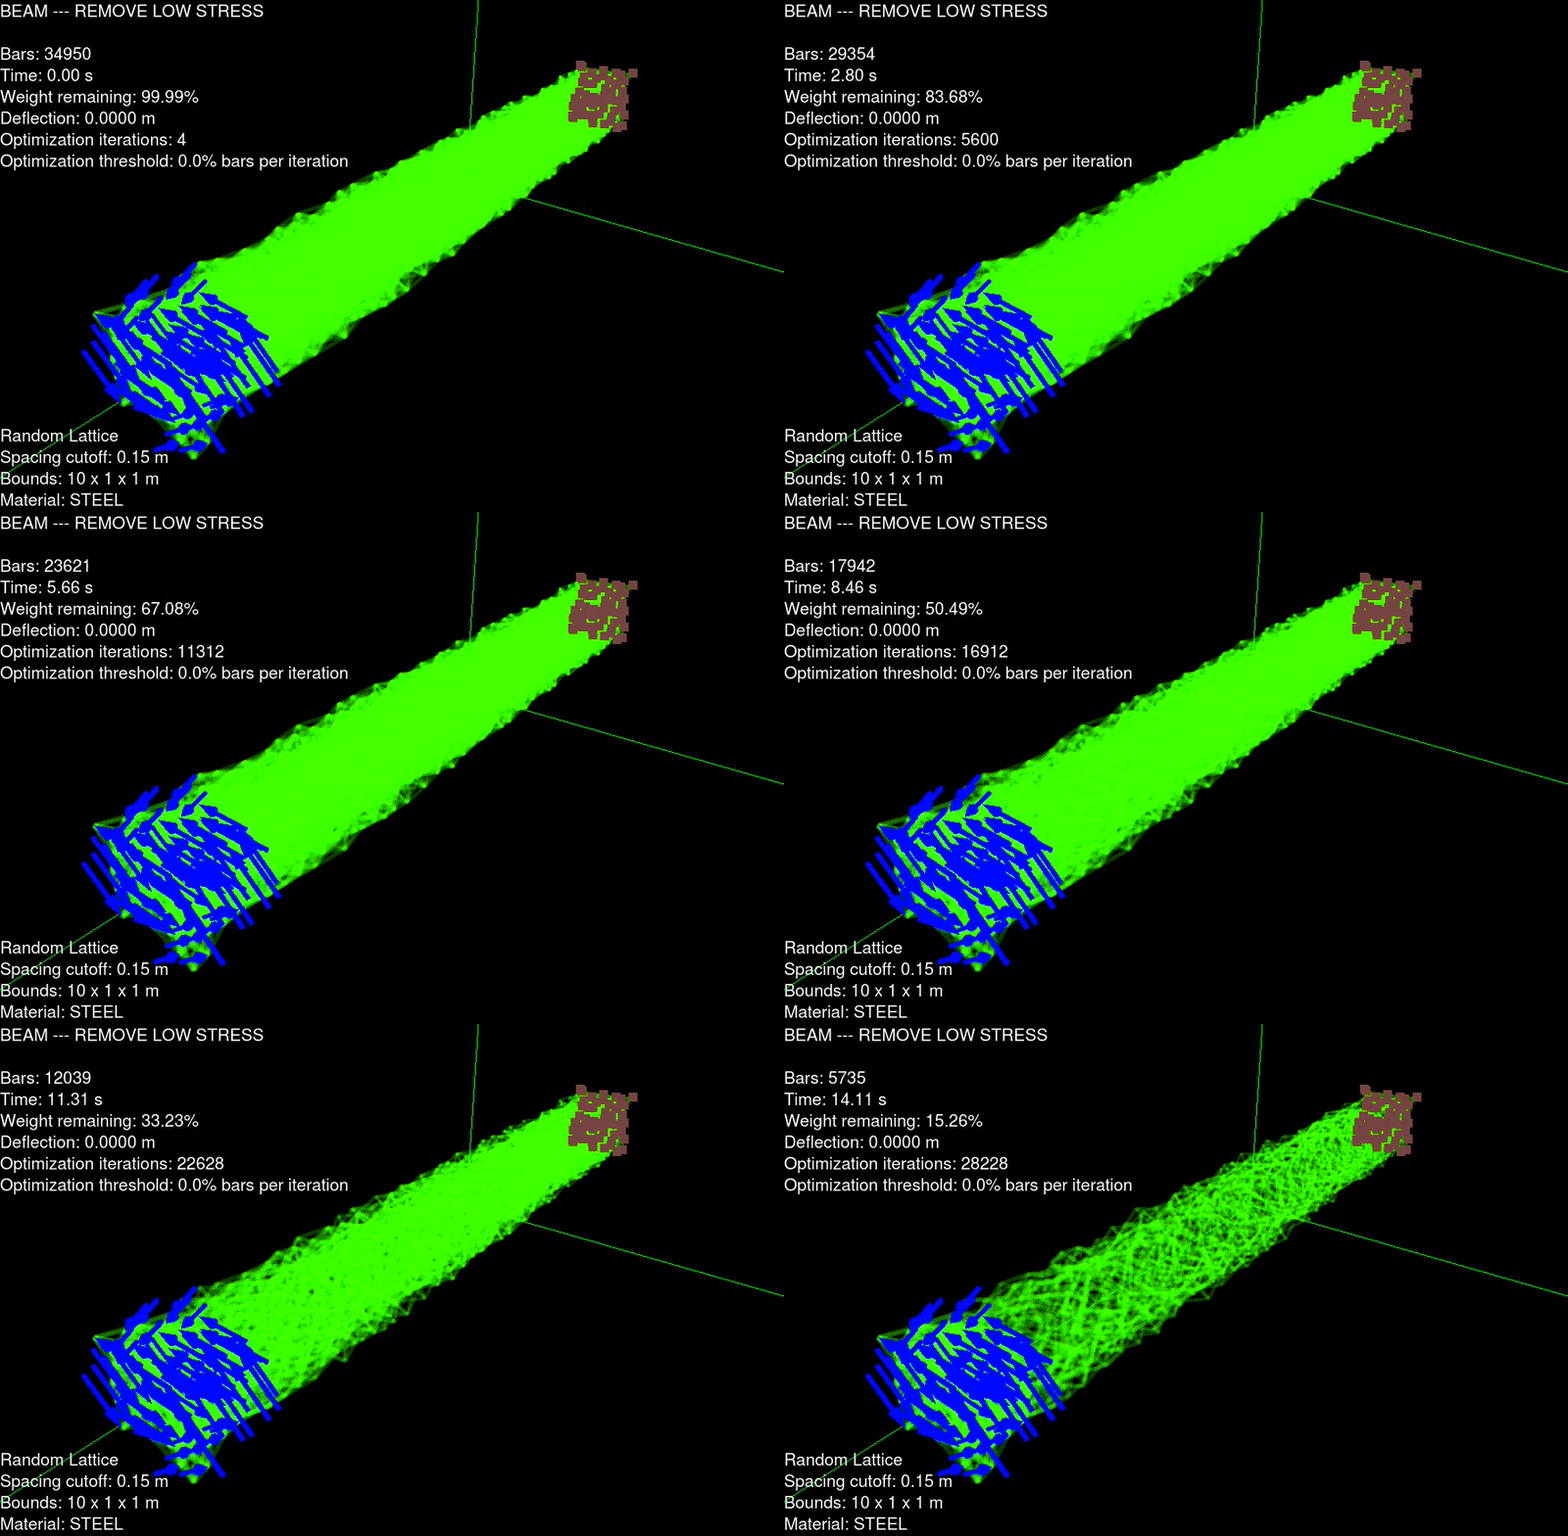
I was assigned to test and debug a program being developed by the Creative Machines Lab at Columbia University, the Design Model Language interactive development environment.
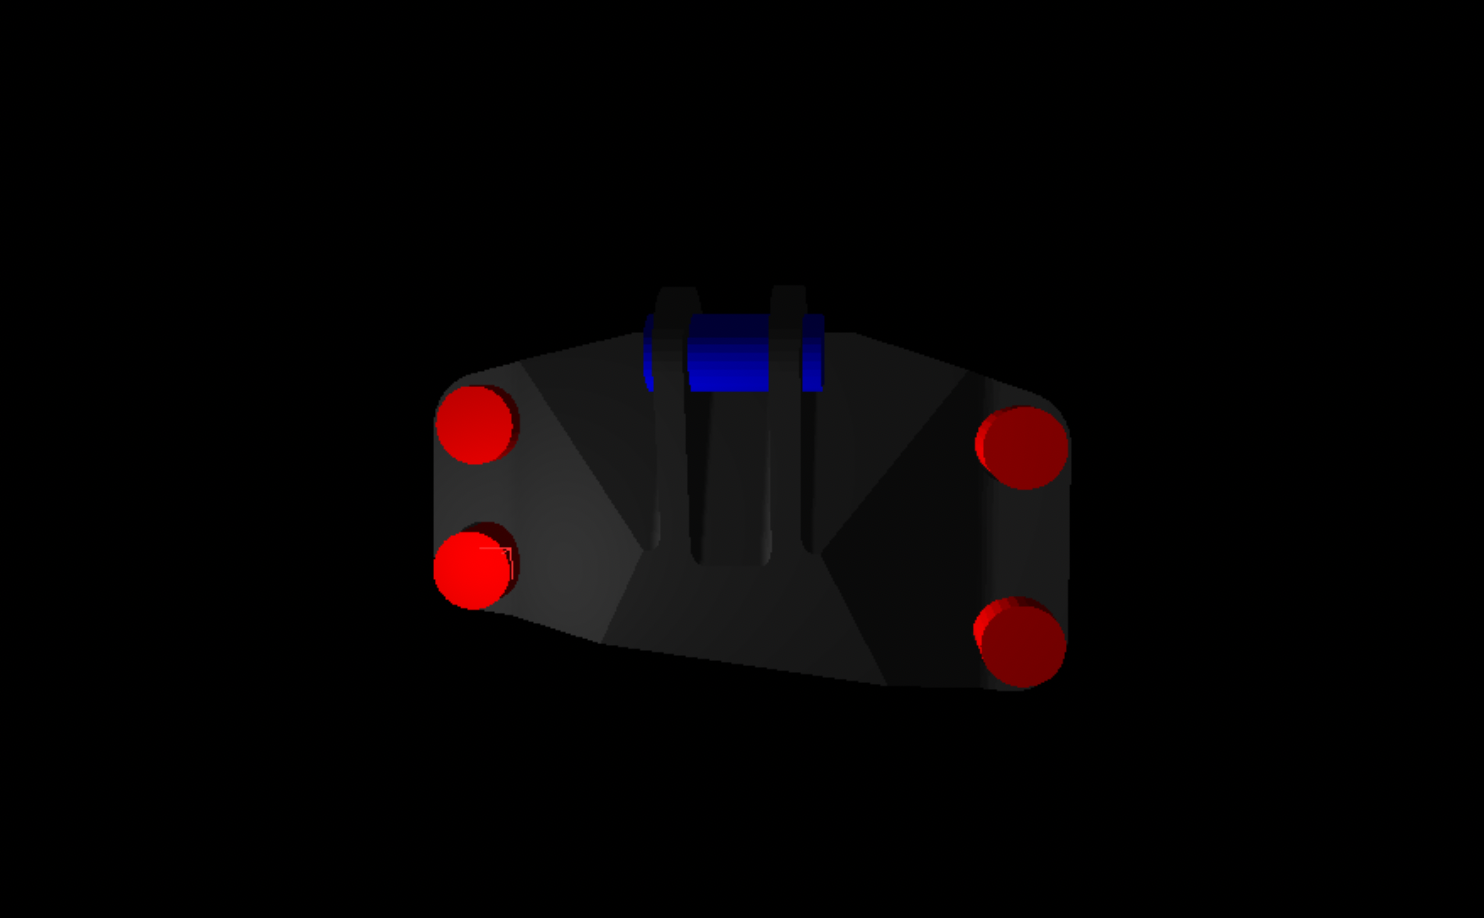
My role as an undergraduate researcher was to test the program by creating different structures to simulate and to find areas in the code and runtime that could be improved.
I used CAD programs, C++/C++ with CUDA and the Nvidia Profiler to complete these tasks.
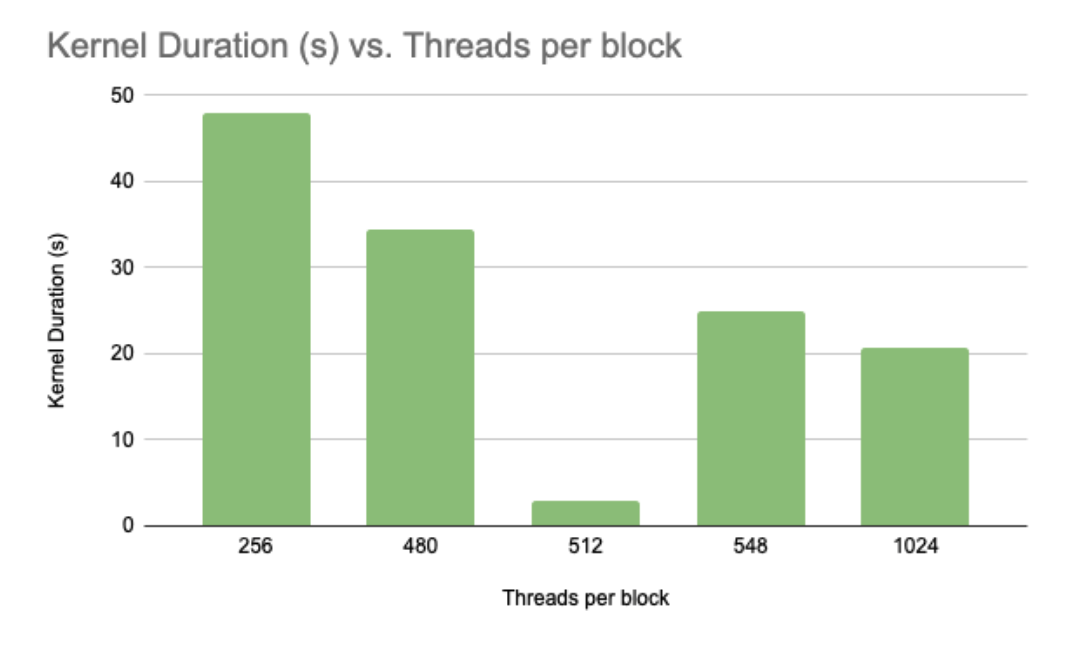
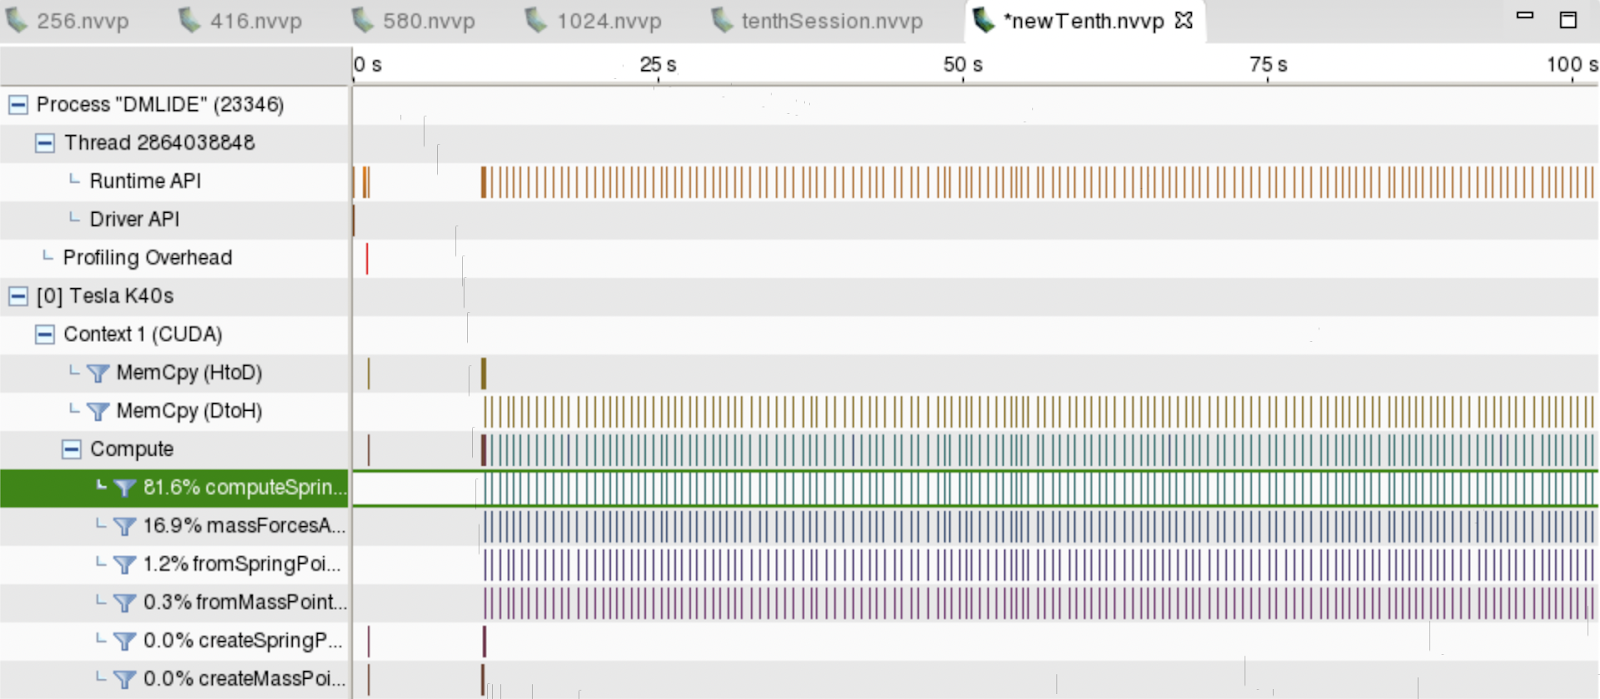
Because the program was very computation heavy when importing large objects that would turn into hundreds of thousands of mass-spring objects, we wanted to benchmark the program in different configurations to find the fastest configuration of memory organization and thread-block use.
Using the Nvidia Visual Profiler, we were able to discern which kernels hosted the longest computation times, and needed reducing. We found that the function with the highest usage of processing power was a function called computeSpringForces( ), which is a necessary step in each timestep of the simulation.
